Product Design Portfolio
Aeris is a connected health and air quality platform designed to help users understand their indoor environment and make informed decisions that support healthier living.
Role
UX/UI Designer
Timeline
5 months
Services
UX Design, UI Design, Information Architecture, Onboarding, Prototyping
Year
2021
Industry
Smart Home / Health Technology
Download
Download app
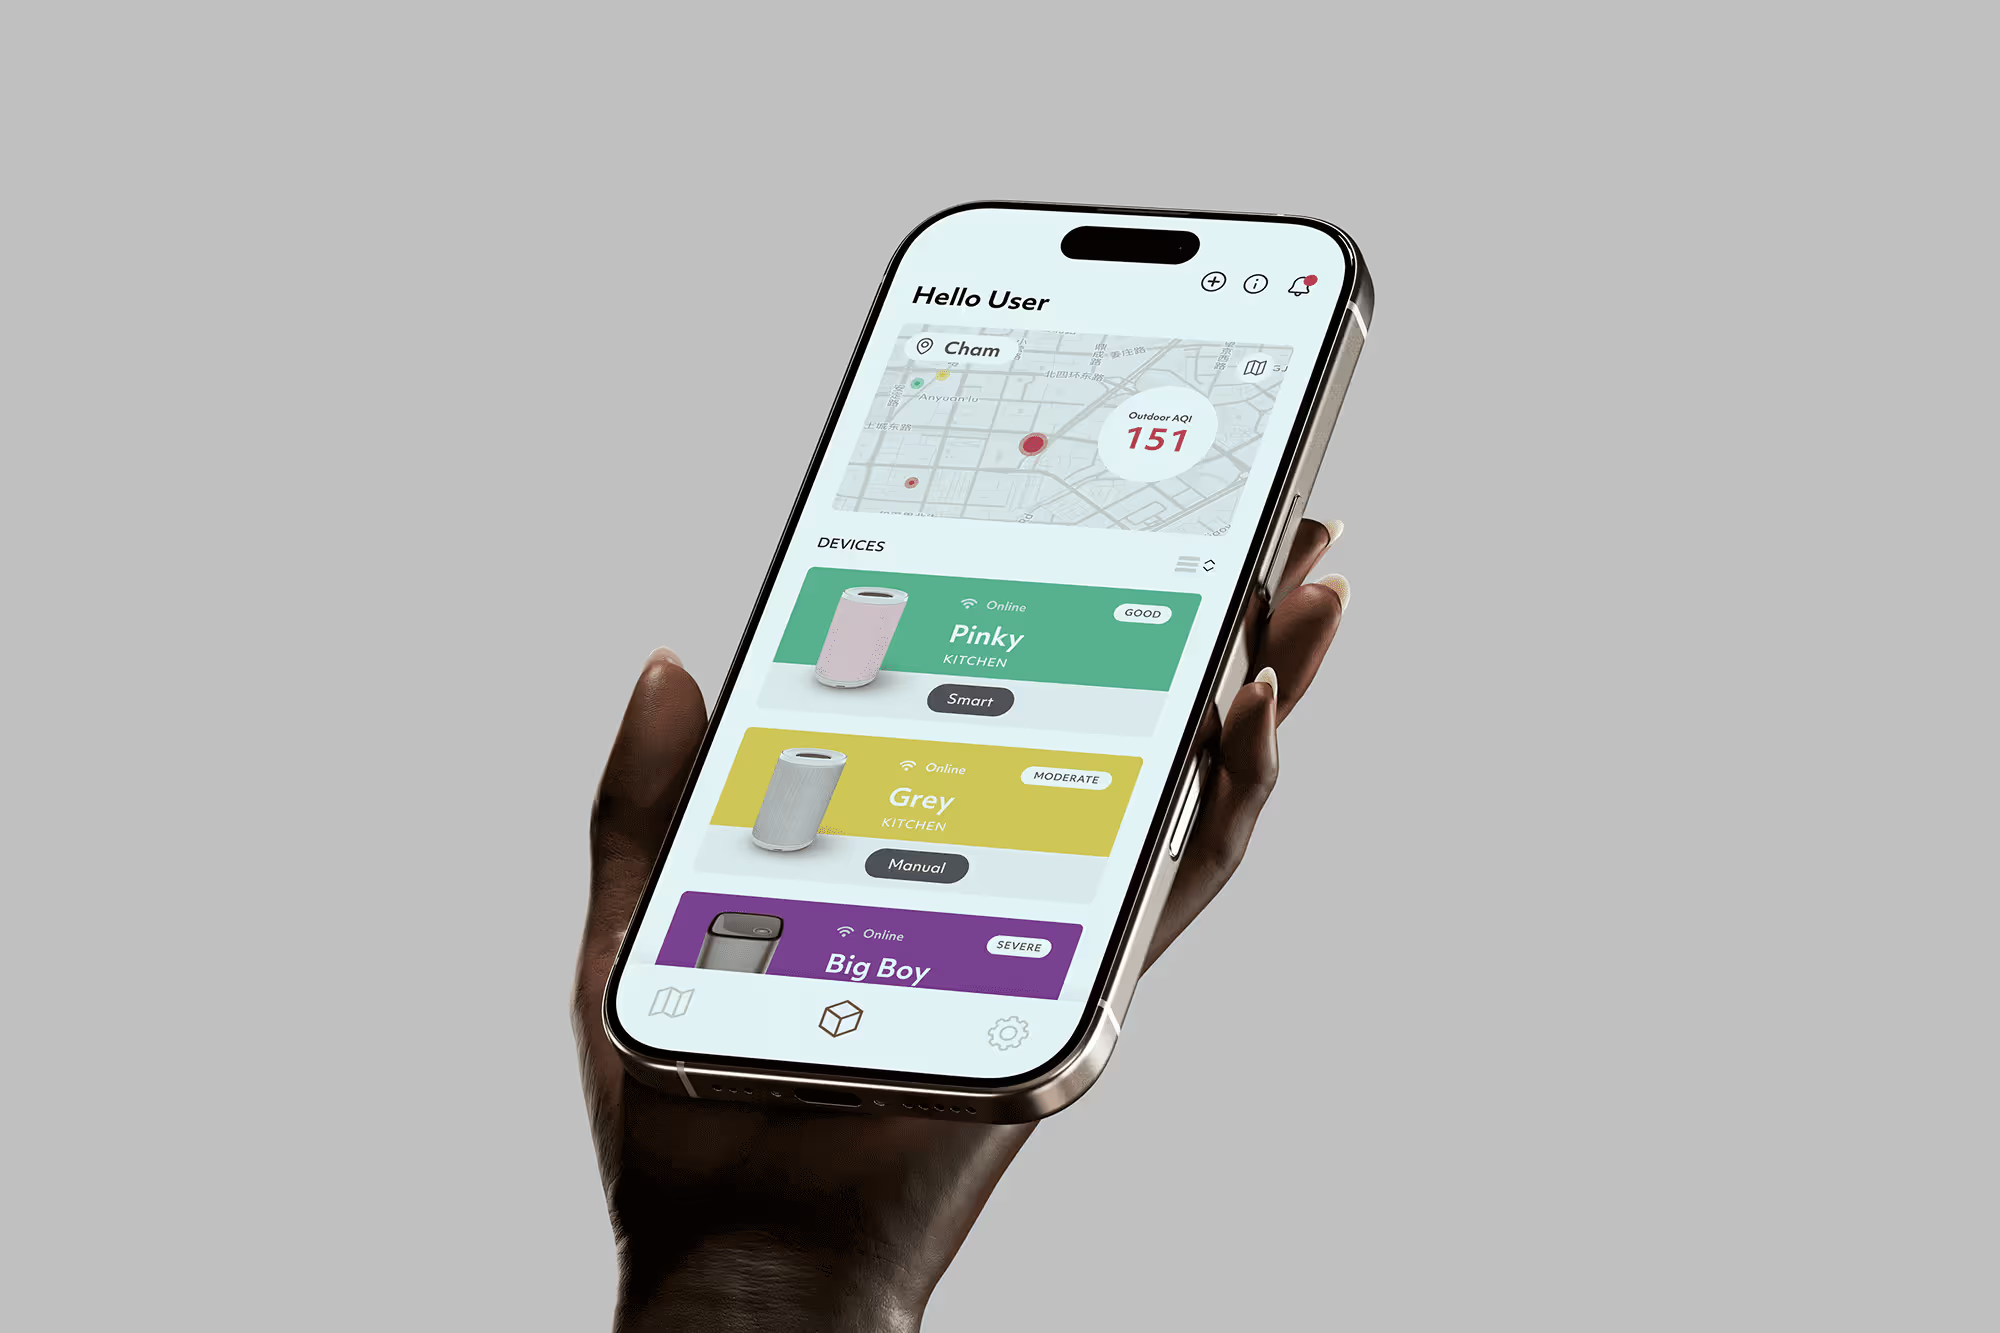
Hand holding a smartphone displaying an app with a map and three connected devices named Pinky, Grey, and Big Boy showing different air quality levels.
Project overview
Aeris Health was created to help users better understand the relationship between indoor air quality and personal wellbeing. While air quality data is often presented through technical metrics, the goal was to create a more human-centred experience that translates environmental information into meaningful insights and actionable recommendations.

The project focused on making complex air quality information accessible, helping users monitor their environment, identify potential risks and take simple actions to create healthier indoor spaces.
Challenge
Most users do not understand technical air quality measurements or how environmental conditions affect their health. Information is often presented through complex data points that provide little context or guidance.

The challenge was to transform environmental data into clear, actionable insights that help users understand their surroundings and make informed decisions about their wellbeing.
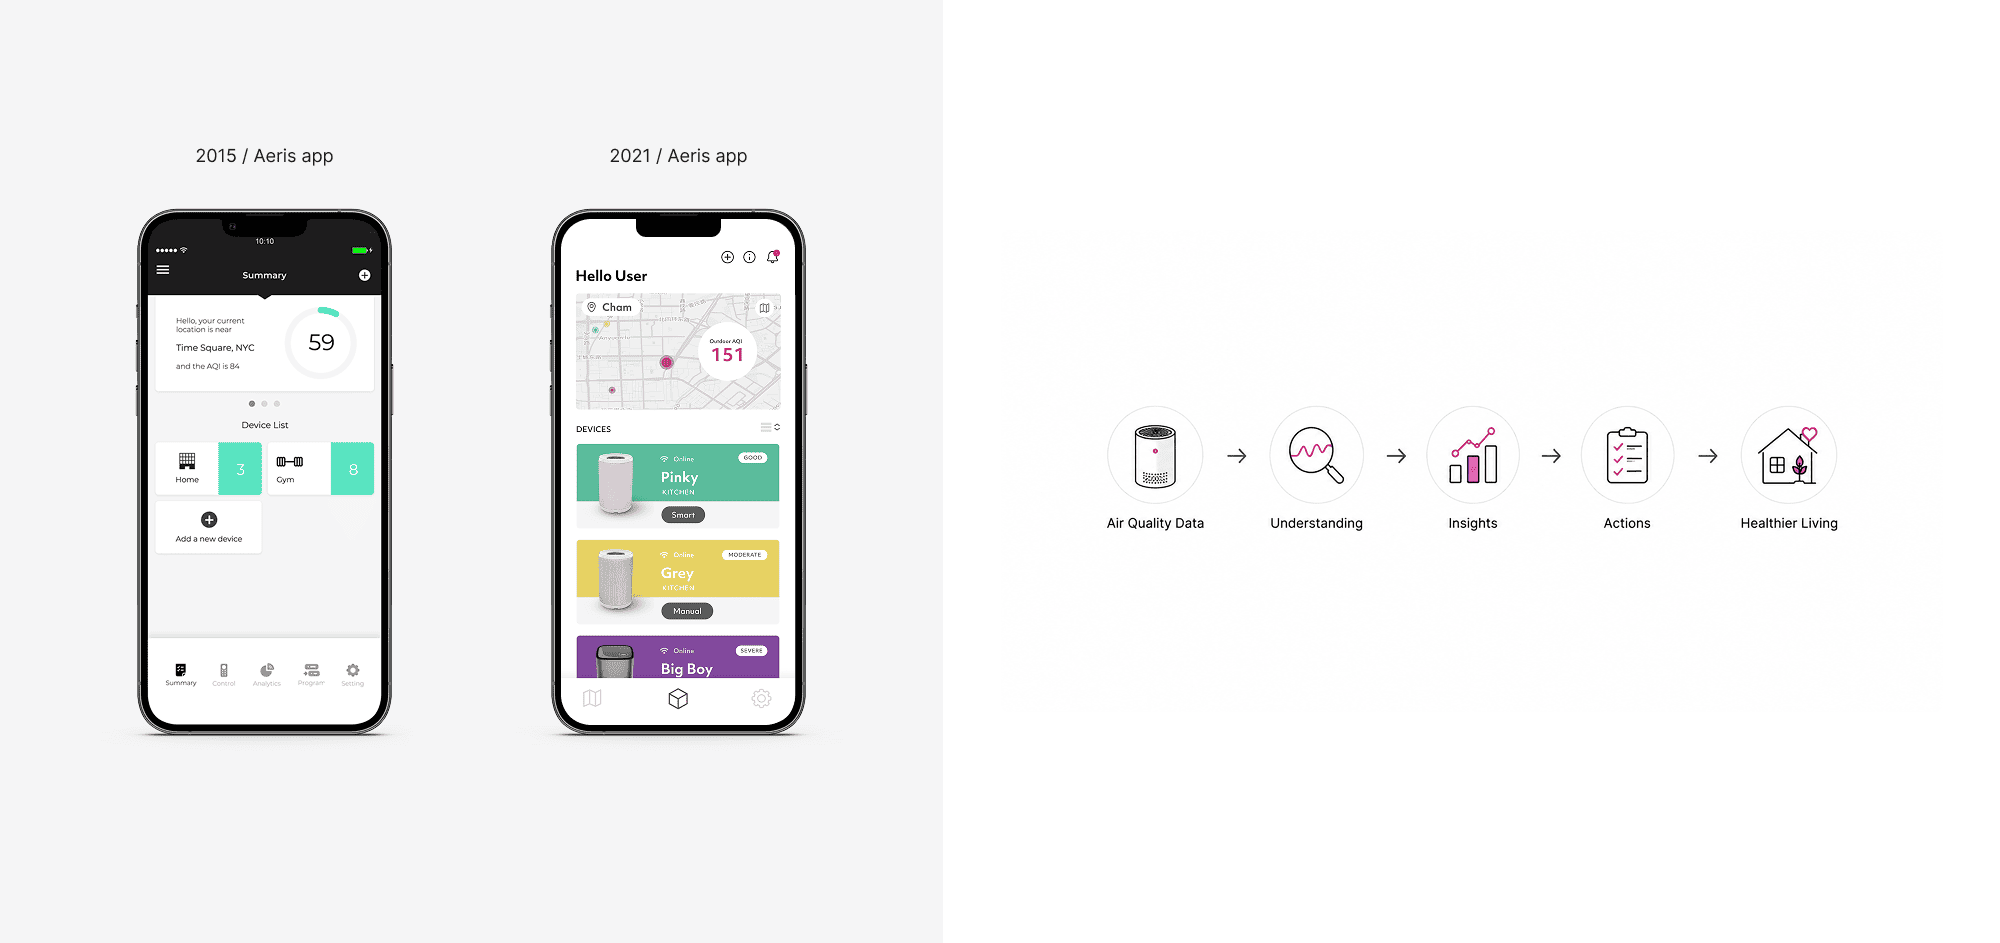
Comparison of 2015 and 2021 Aeris app interfaces and a flowchart showing air quality data to healthier living.
Solution
The experience was designed to bridge the gap between environmental data and everyday decision-making. Air quality information was simplified and presented through intuitive visualisations, helping users quickly understand current conditions and their potential impact on wellbeing.

The platform combines monitoring, insights and recommendations into a single experience that supports healthier habits and greater environmental awareness.
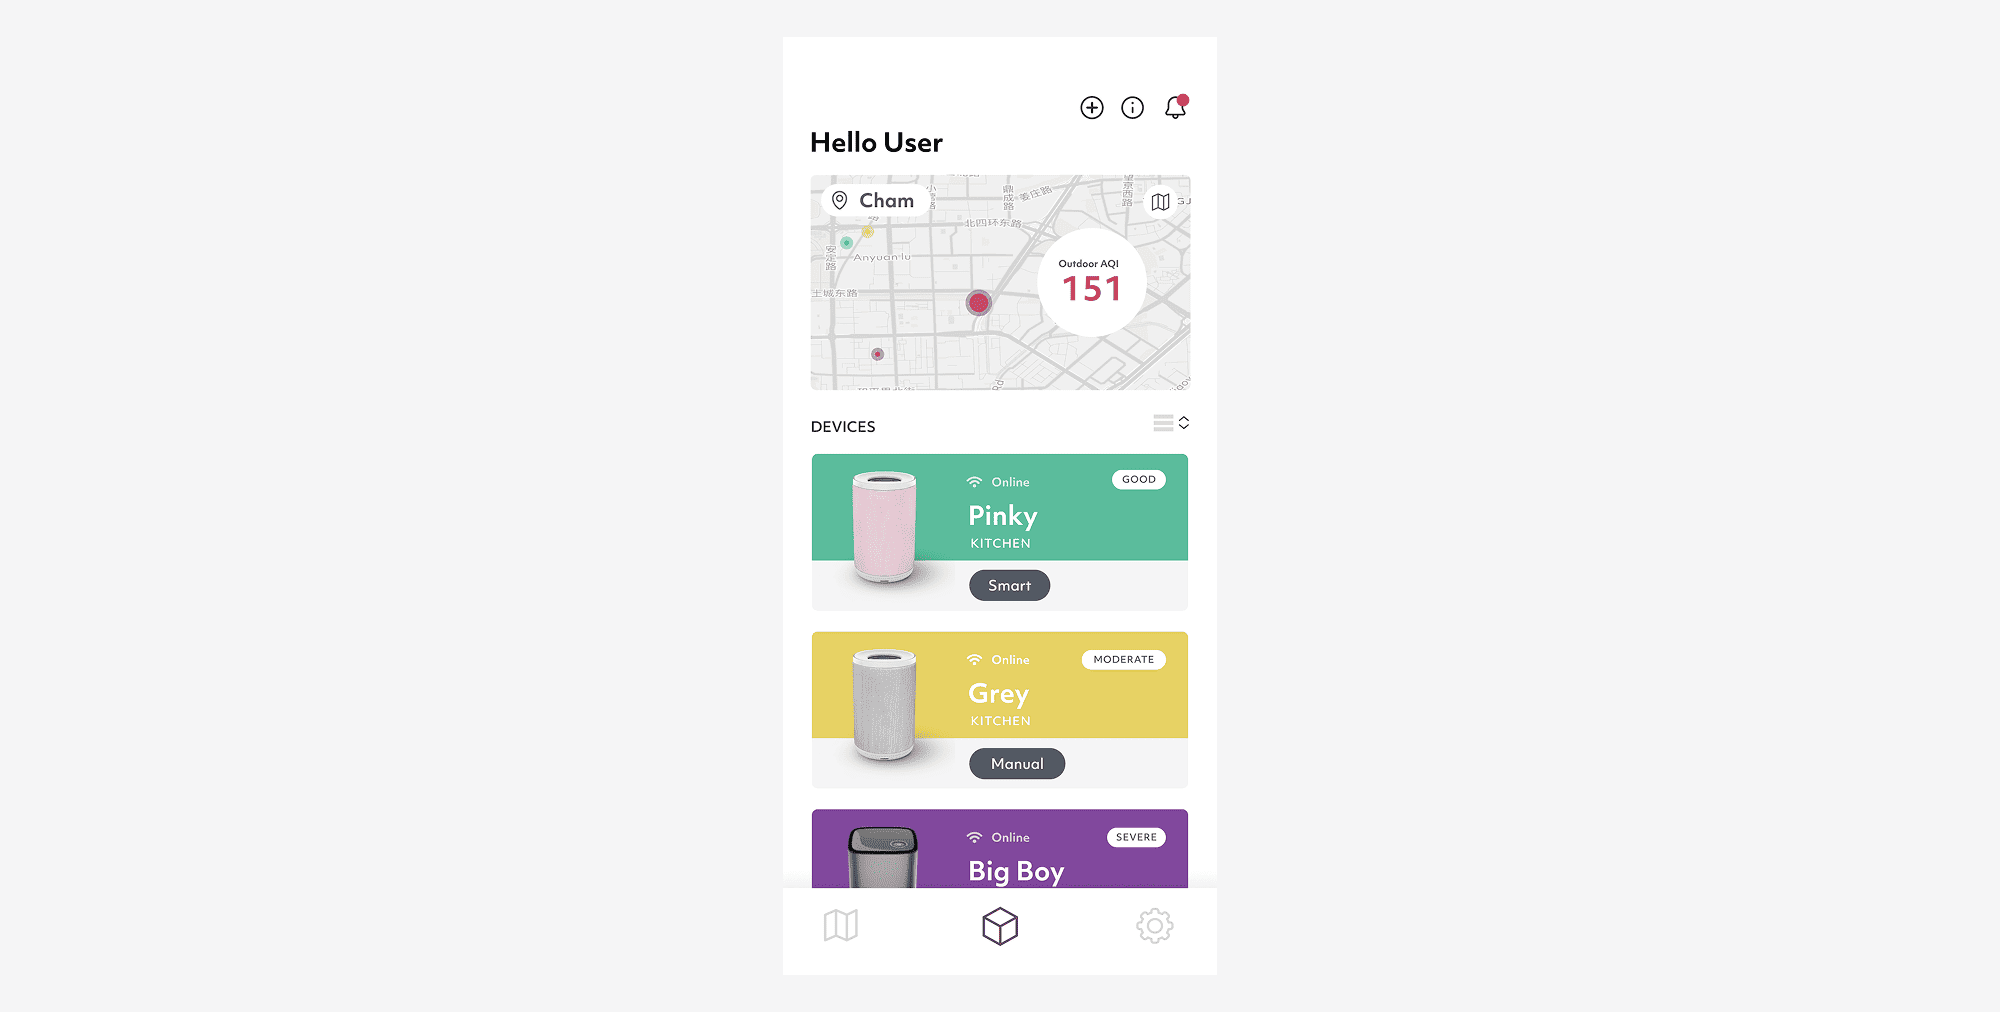
Smart home app dashboard showing external AQI 151 and three online devices named Pinky, Grey, and Big Boy.
Users can view real-time air quality conditions and understand the overall health of their indoor environment at a glance.
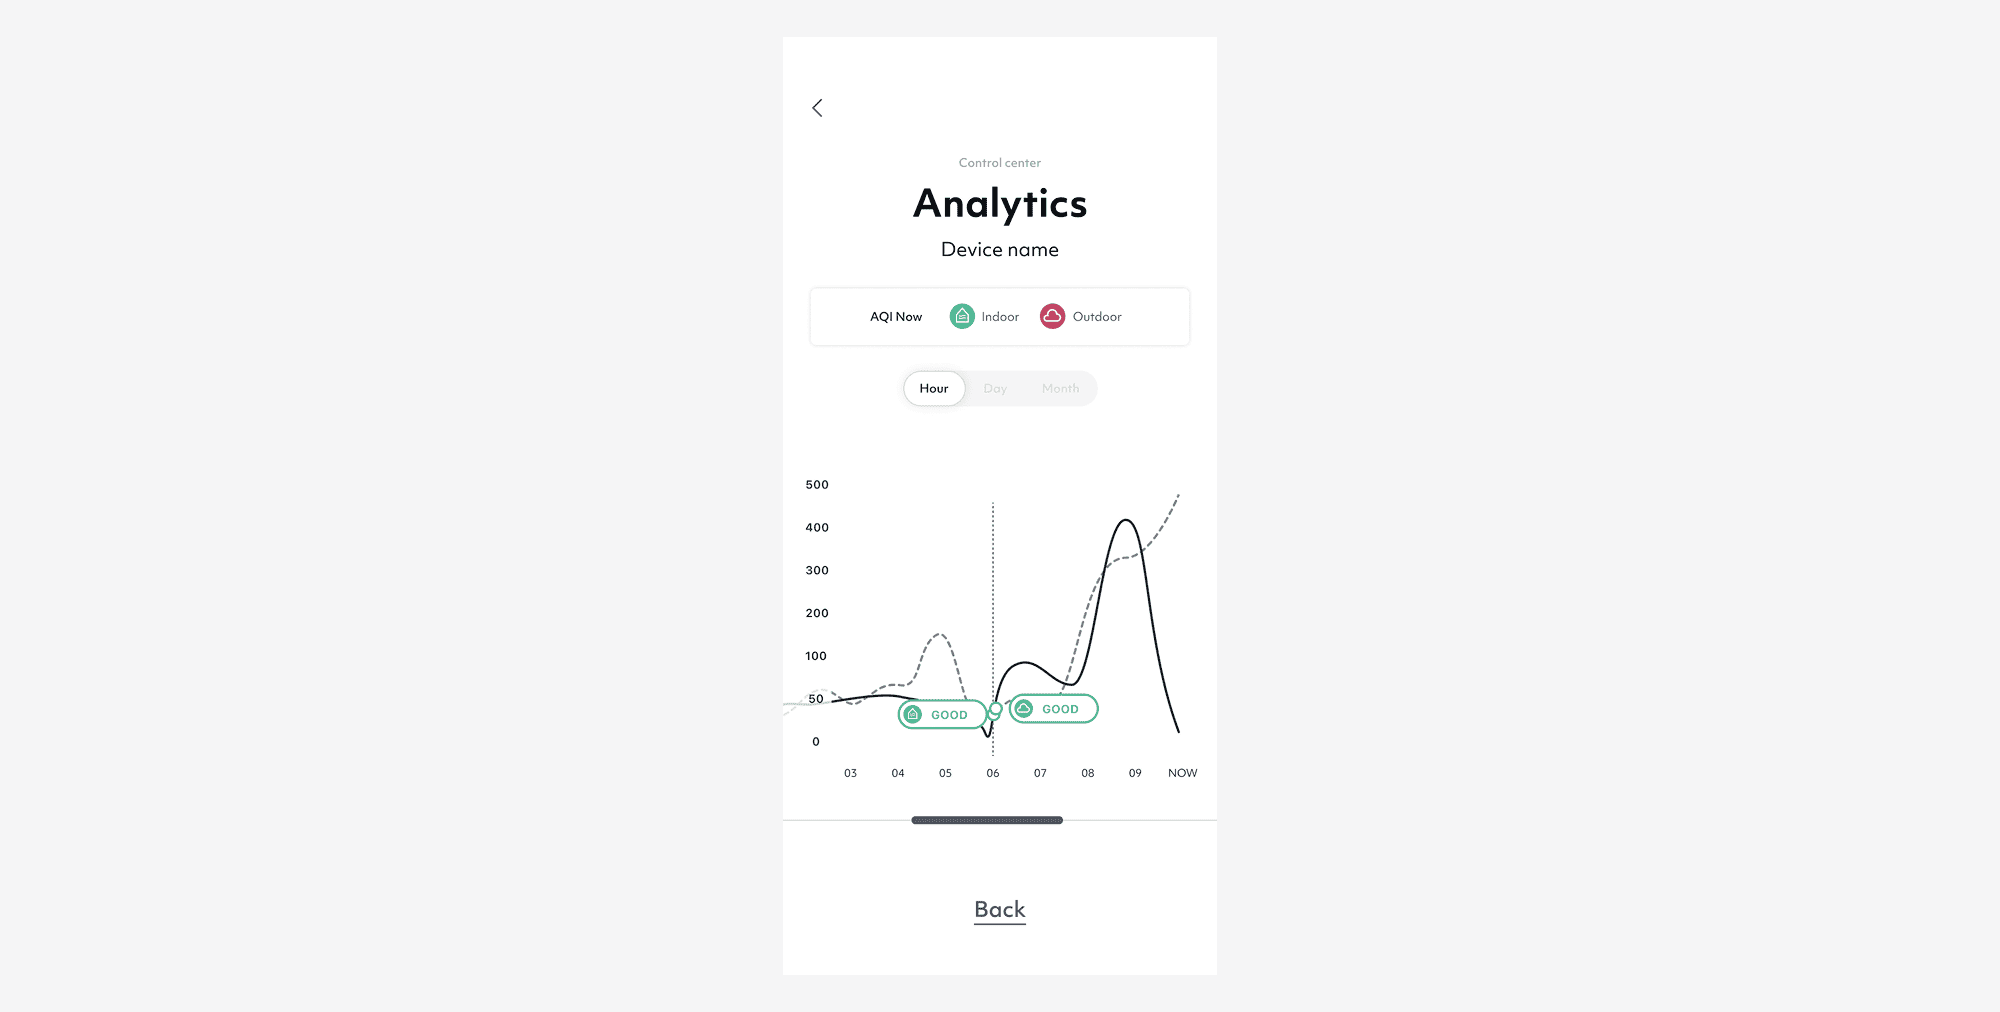
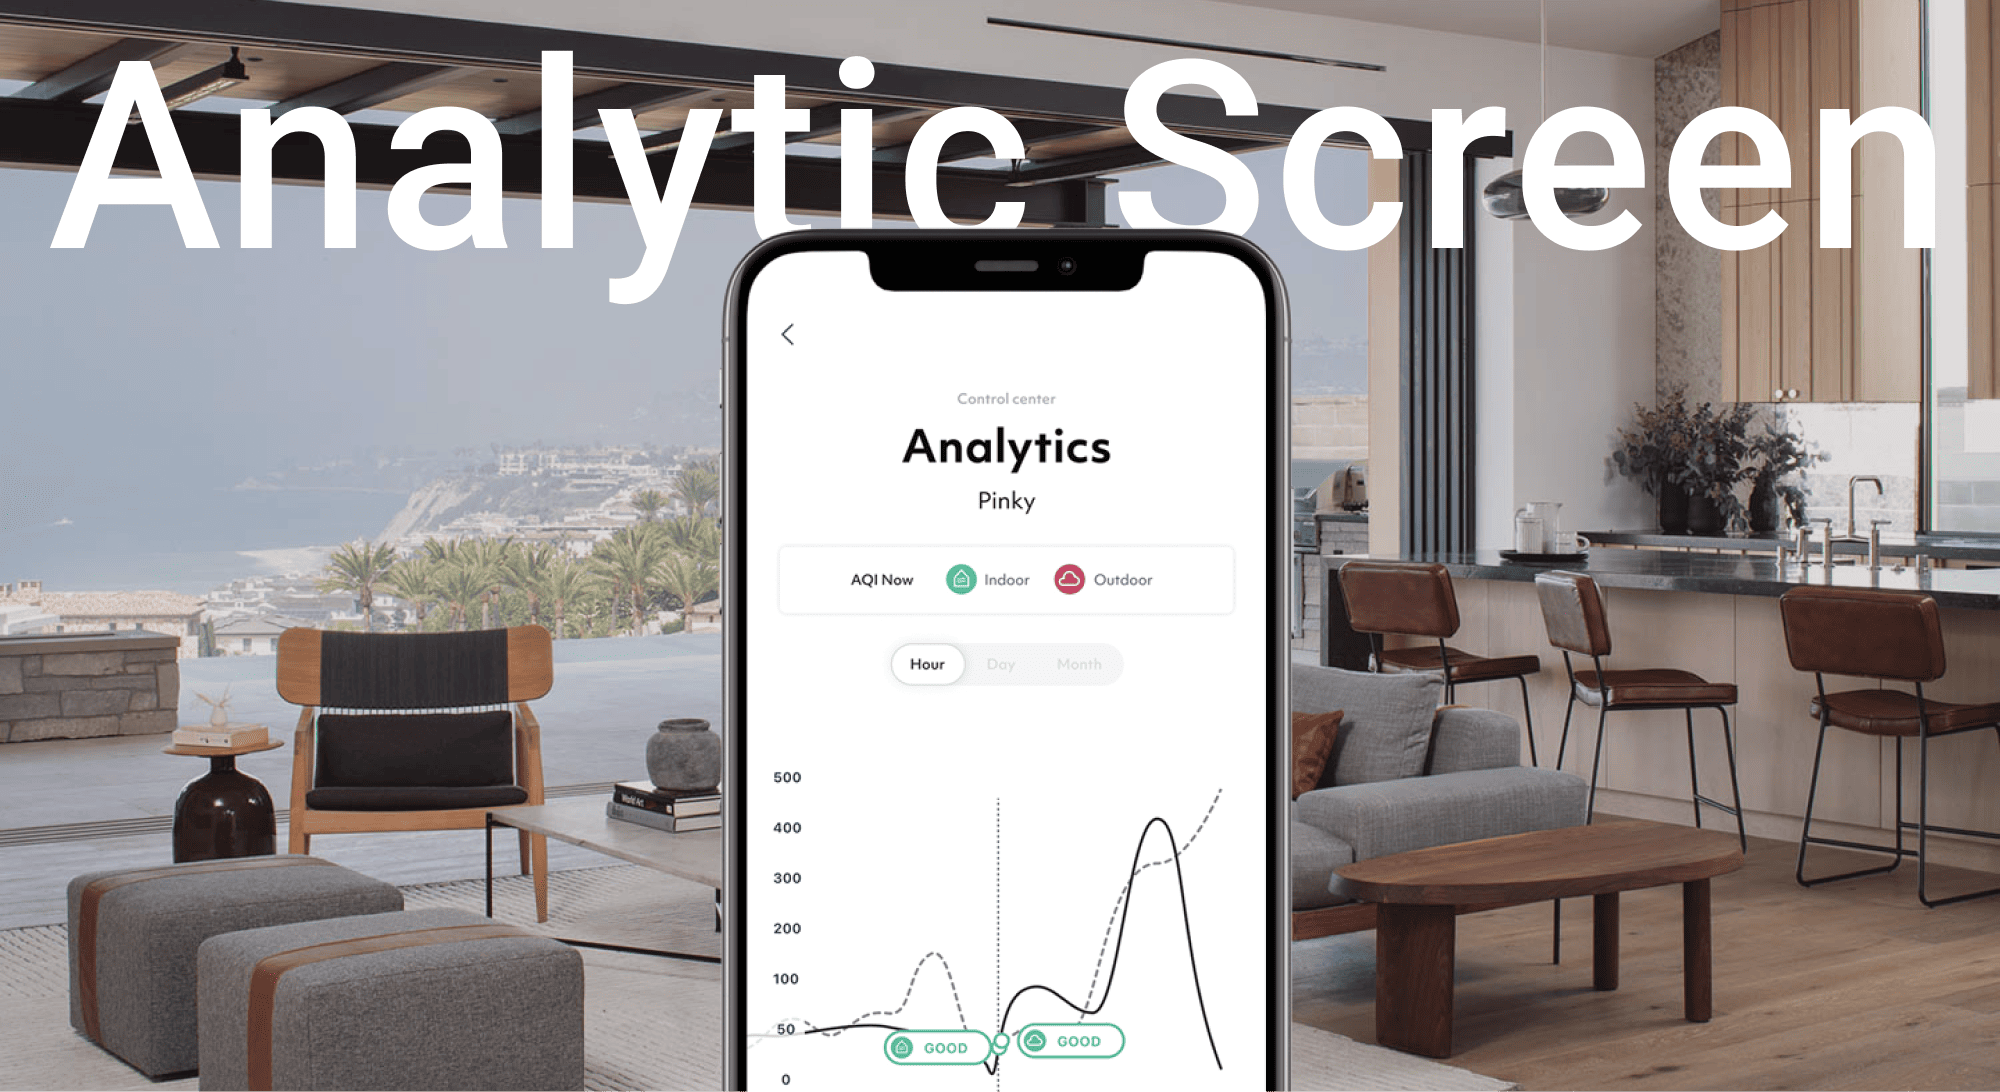
Mobile screen showing air quality analytics with indoor and outdoor AQI graph on hourly basis.
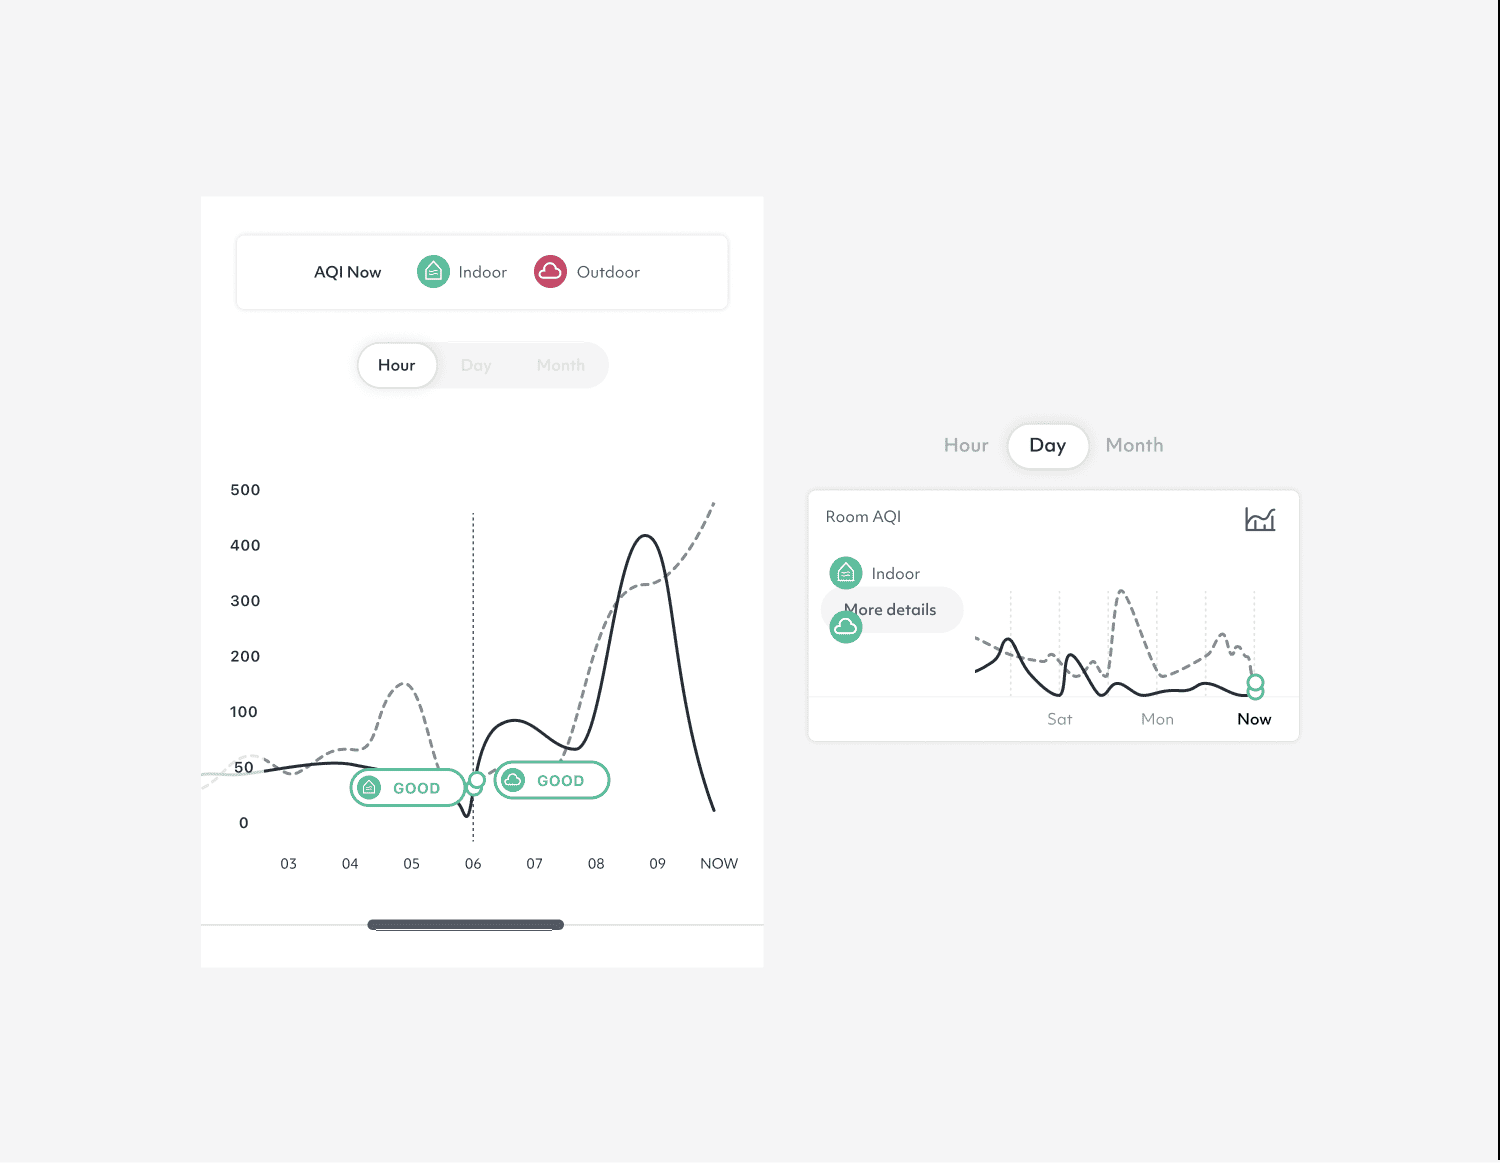
Data visualisations help users identify trends and understand how air quality changes over time.
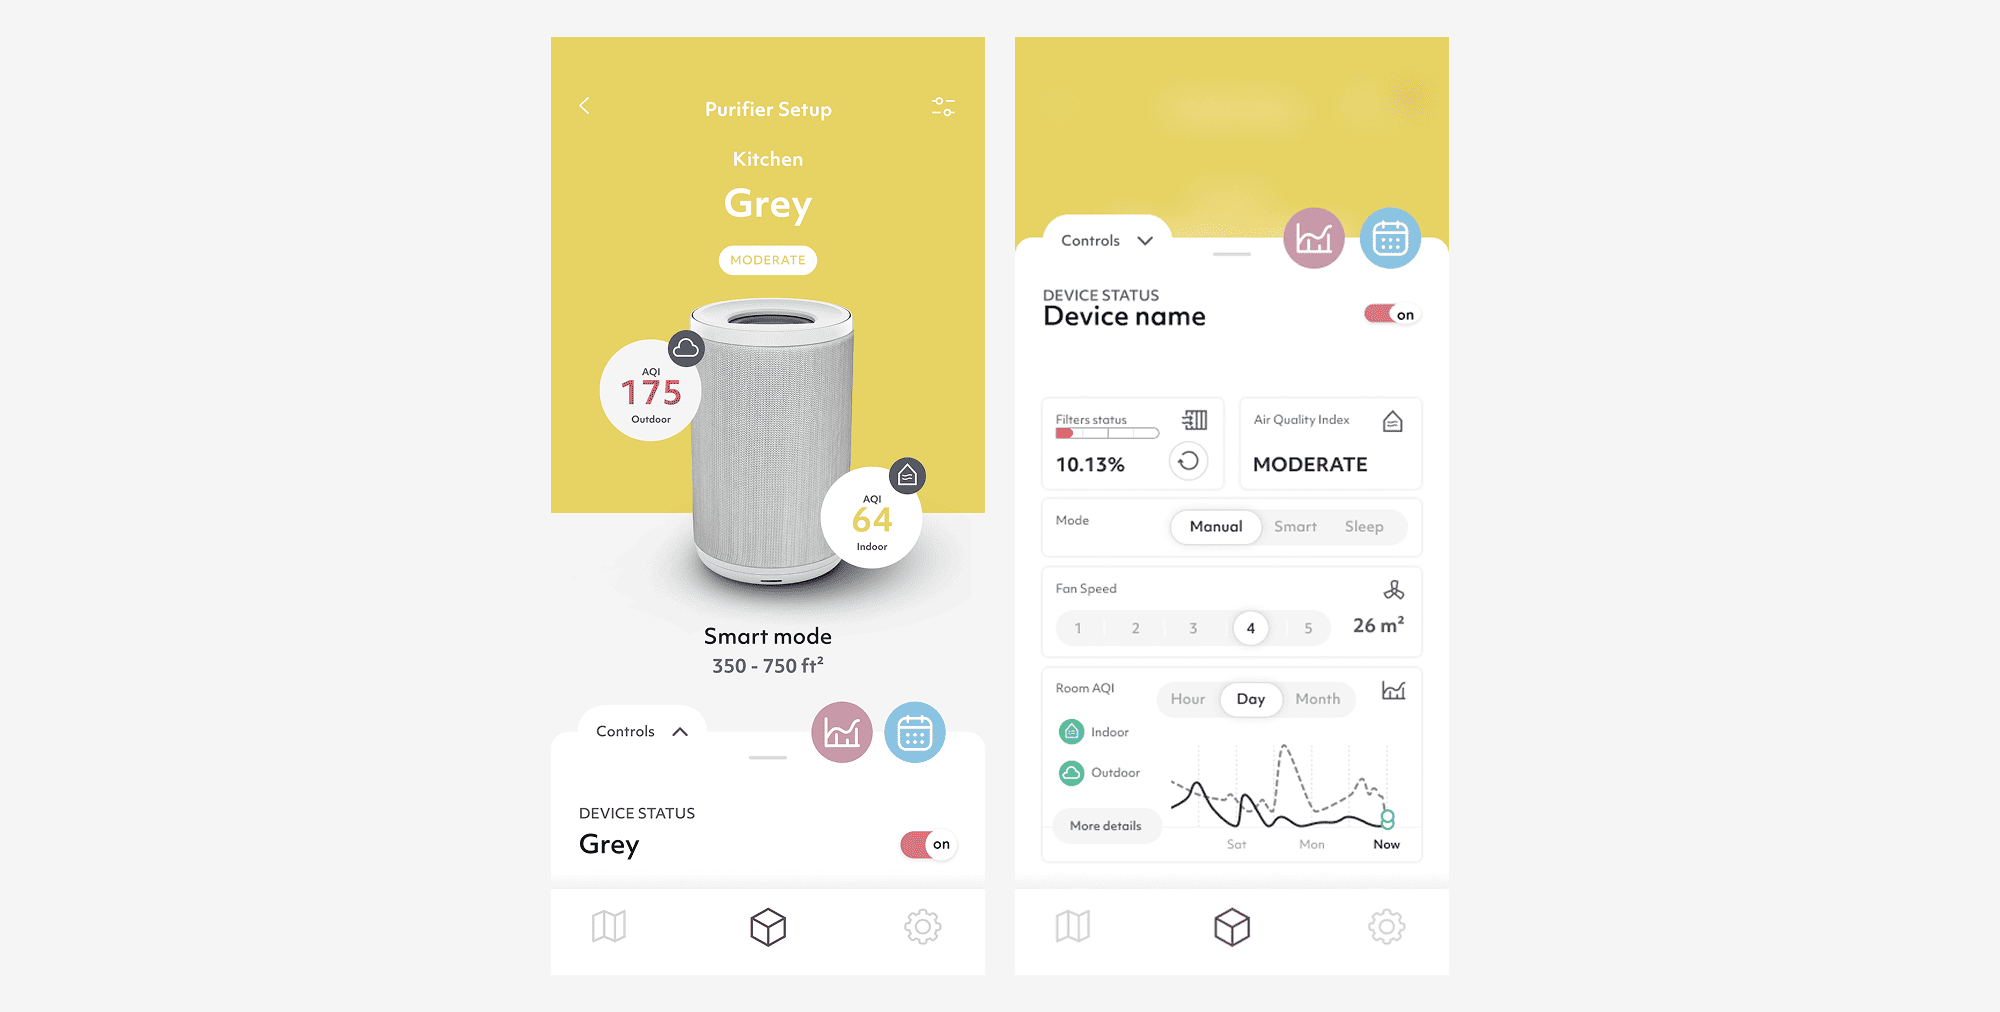
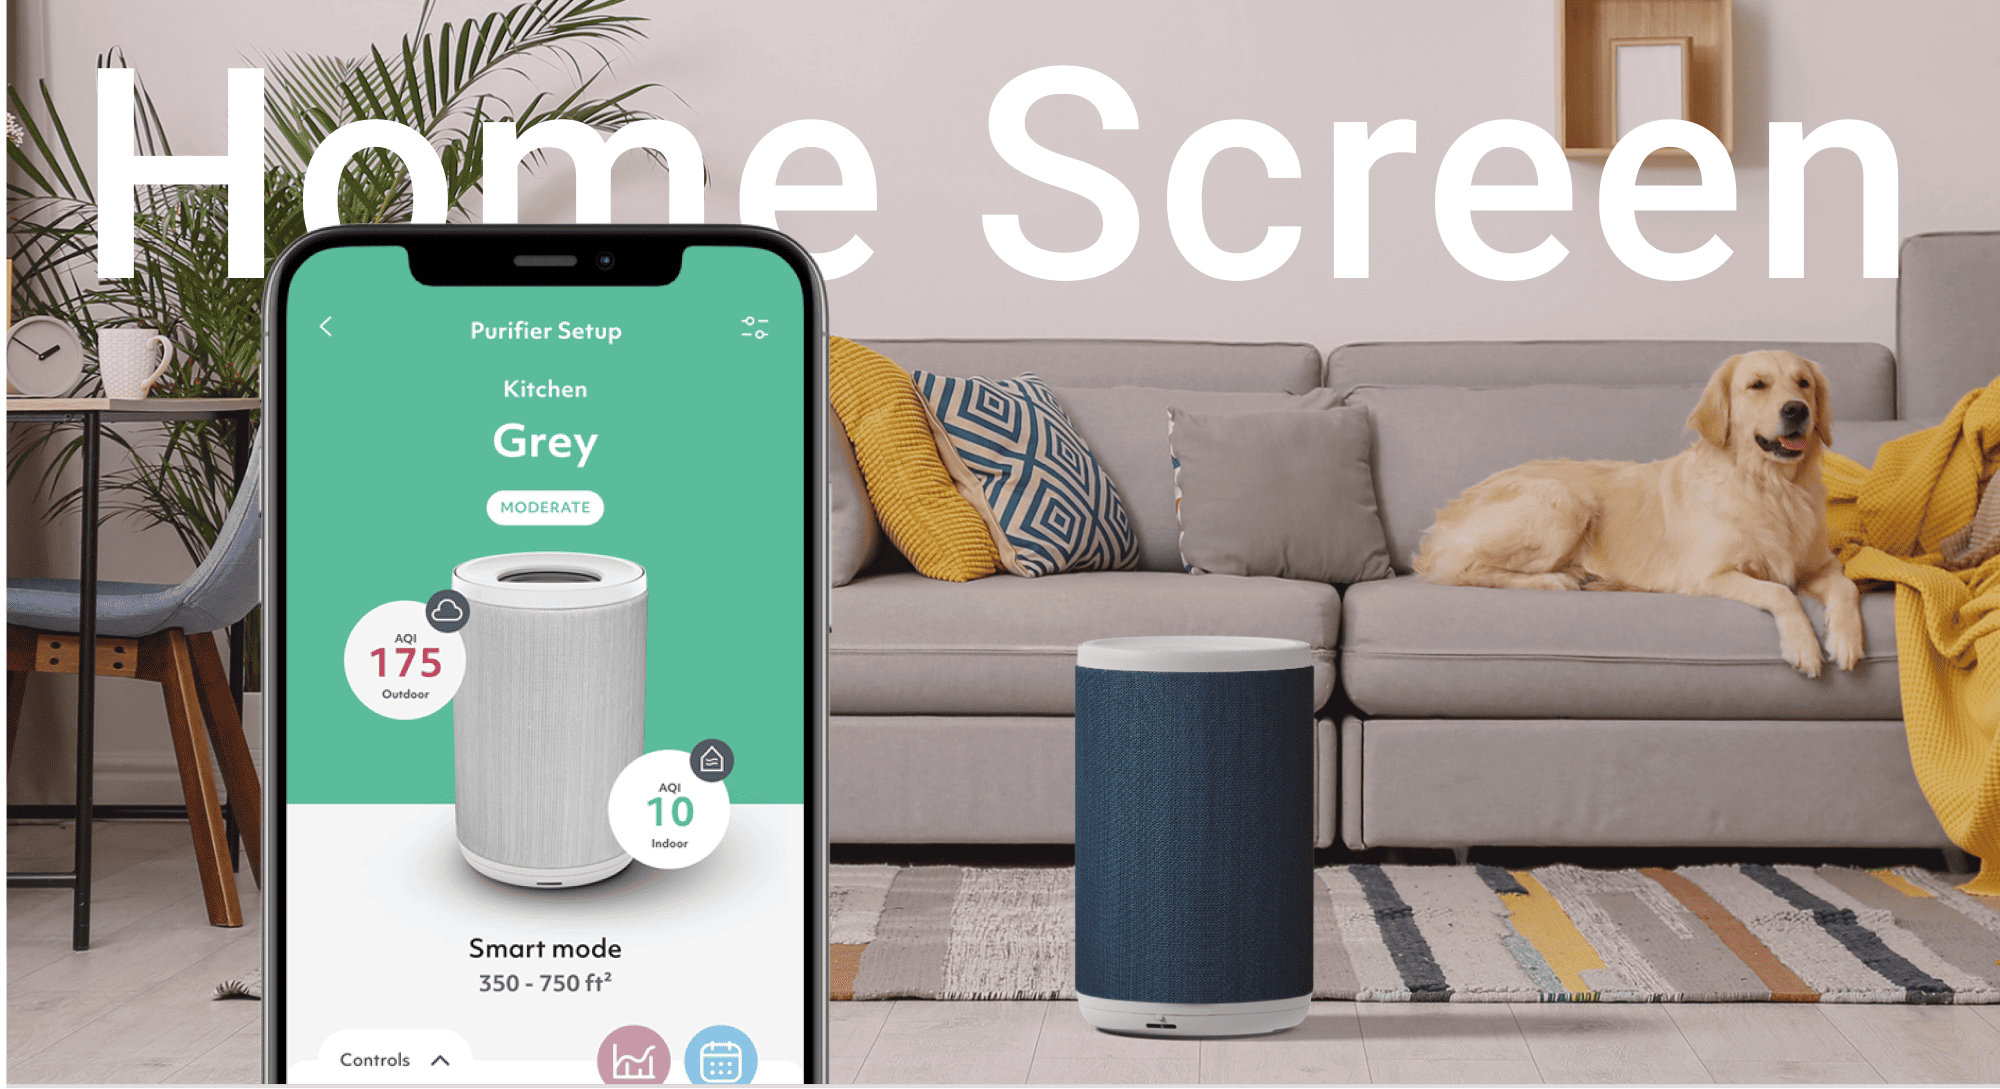
Smart purifier app screen showing kitchen air quality, device status, fan speed, and AQI graphs.
Actionable recommendations provide guidance on how to improve indoor air quality and create healthier living conditions.
Key Features
Real-Time Monitoring
Continuous tracking of indoor air quality conditions through clear and accessible metrics.
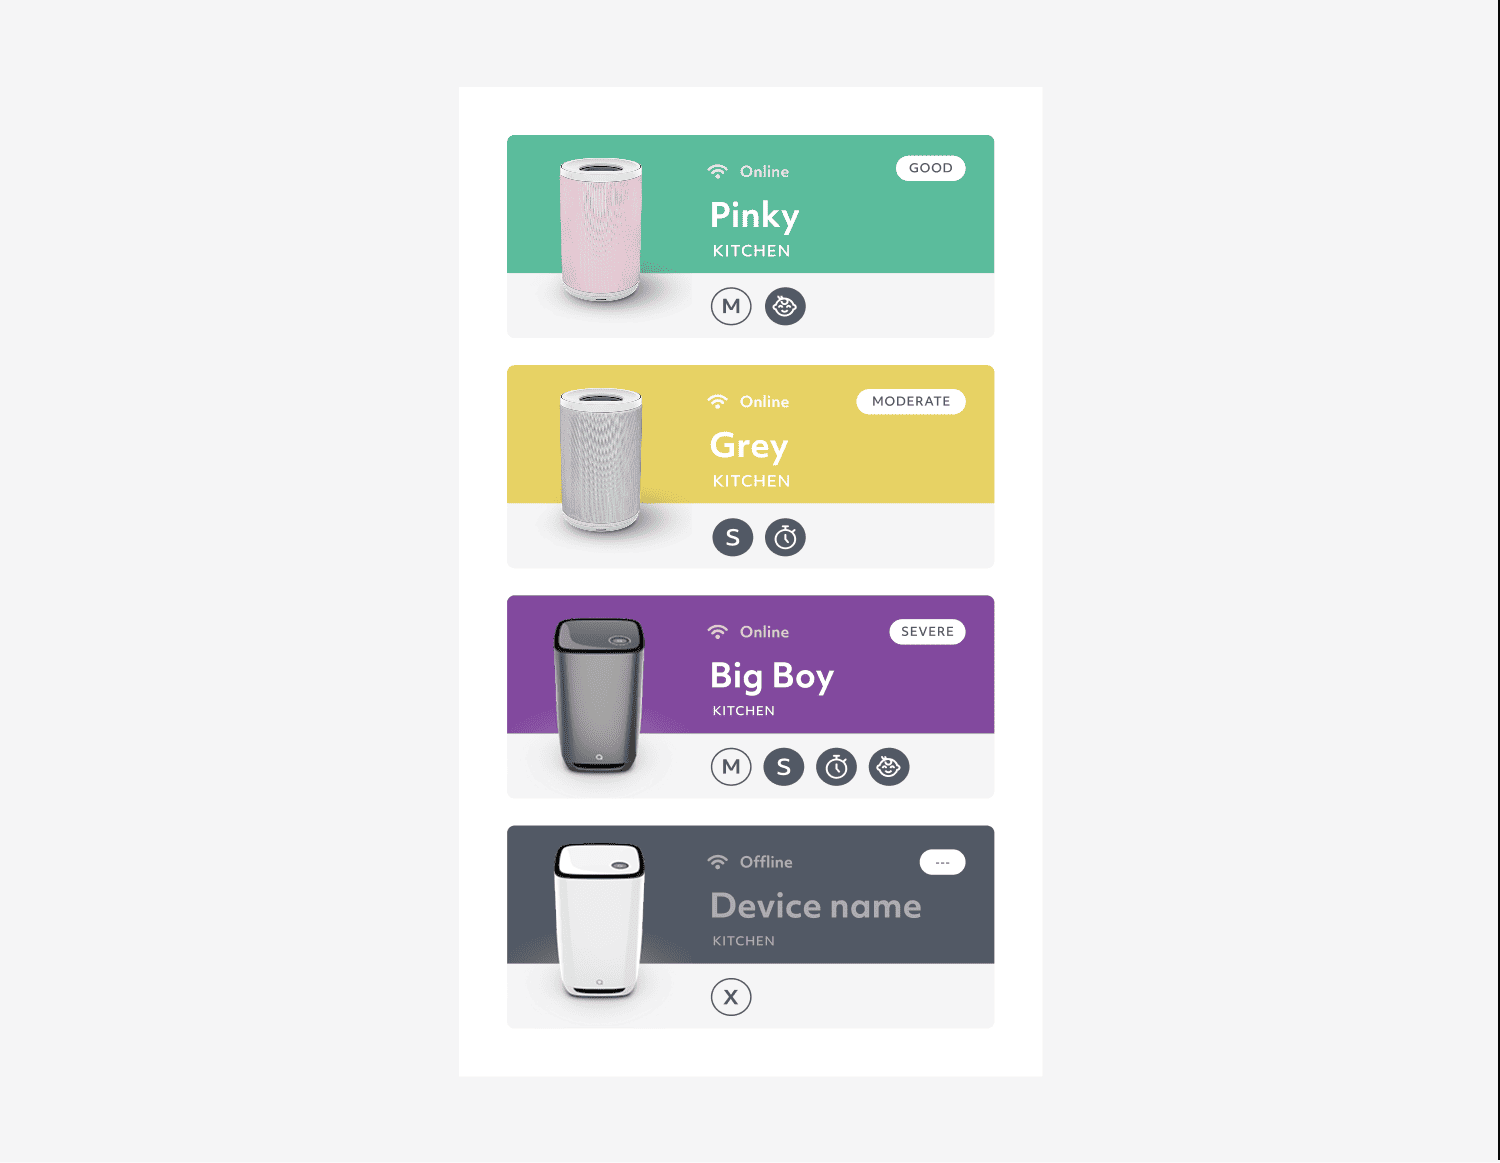
Dashboard showing four kitchen air purifiers with their online status and air quality ratings.
Air Quality Analytics
Historical data helps users identify patterns and better understand environmental changes.
Graphs showing indoor and outdoor air quality index (AQI) data over hourly and daily timeframes.
Health Insights
Environmental information is translated into meaningful insights that connect air quality with everyday wellbeing.
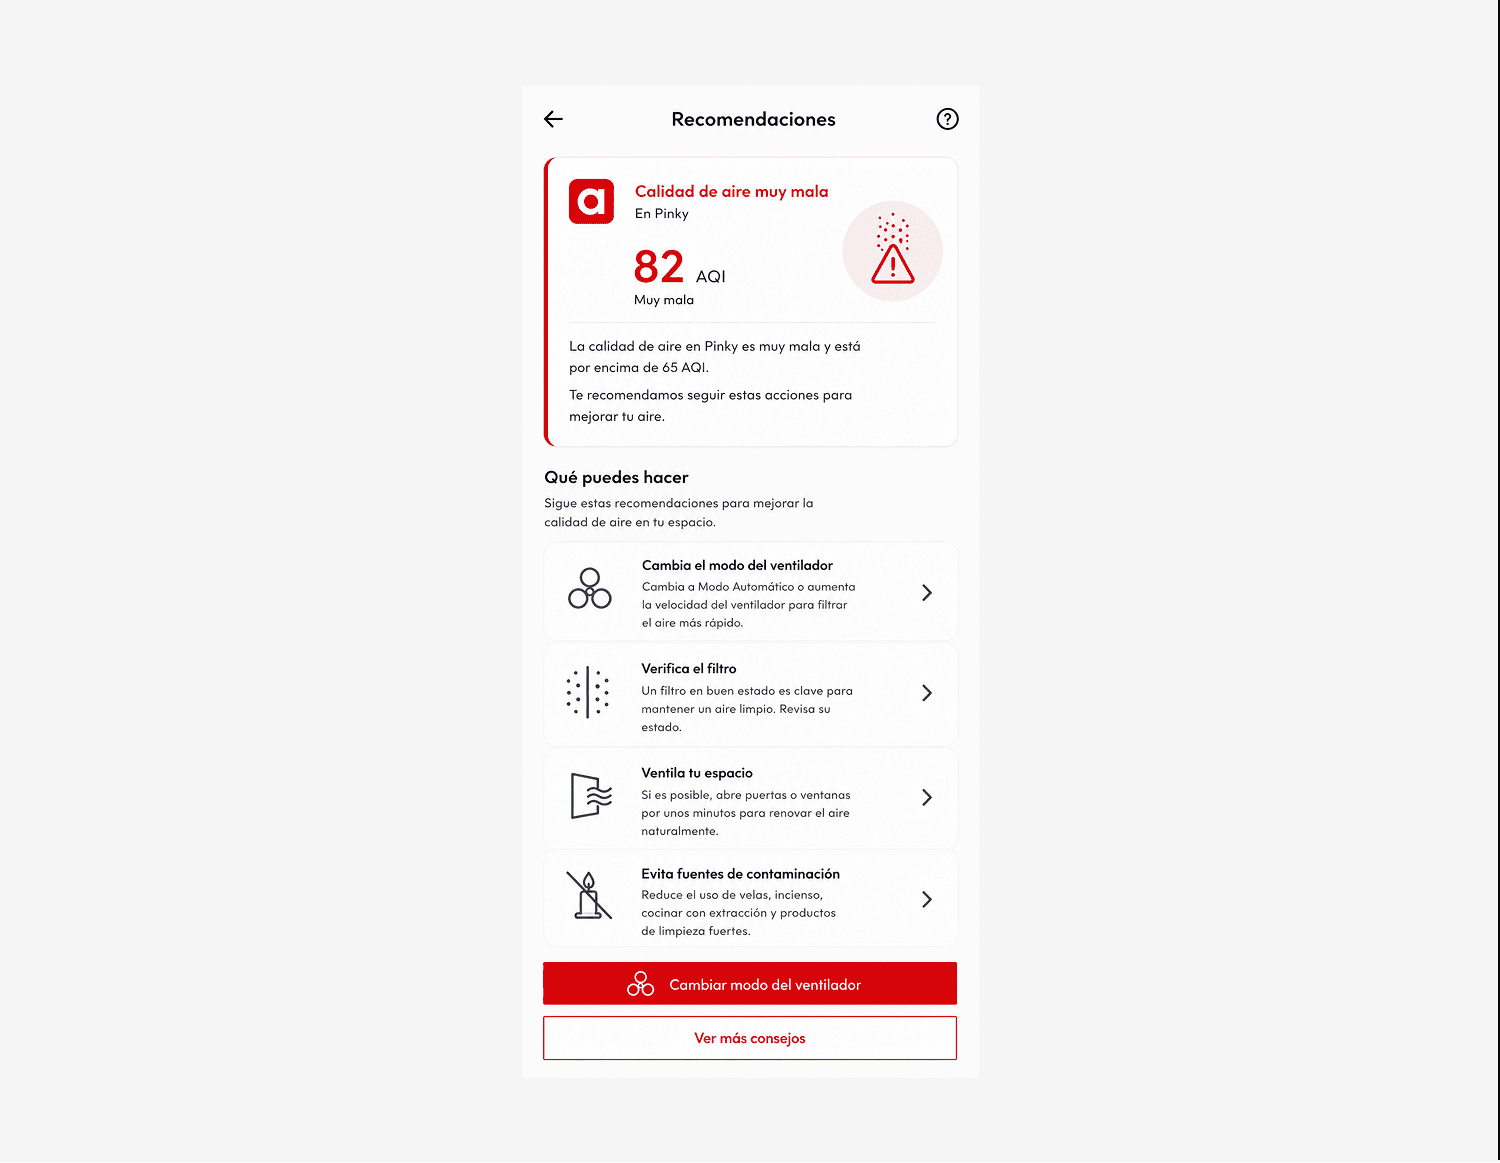
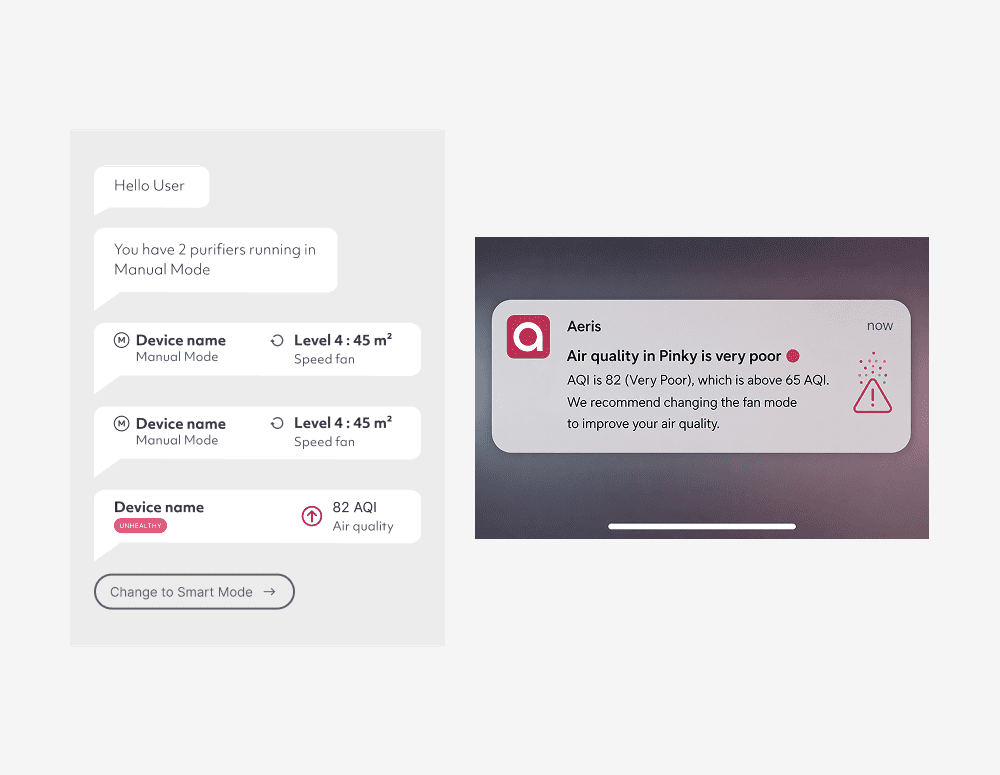
App screen with poor air quality warning, AQI 82, and tips to improve air quality indoors.
Smart Notifications
Timely alerts help users respond to changes in air quality and maintain a healthier environment.
Air purifier control showing two devices in manual mode and a notification of poor air quality with AQI 82.
Key Decisions
Making air quality data easier to understand
The experience focused on translating technical environmental data into information that users could quickly interpret and act upon.
Encouraging habit-based monitoring
The dashboard was designed to help users regularly check and understand changes in their indoor environment rather than only interacting with the product when problems occurred.
Balancing information and simplicity
Environmental data can become overwhelming. The interface prioritised the most relevant metrics while keeping secondary information accessible when needed.
Outcome
The final concept demonstrates how environmental technology can become more accessible by translating complex air quality information into meaningful insights and practical actions.

By focusing on understanding rather than raw data, the experience helps users make more informed decisions about their health and indoor environment.
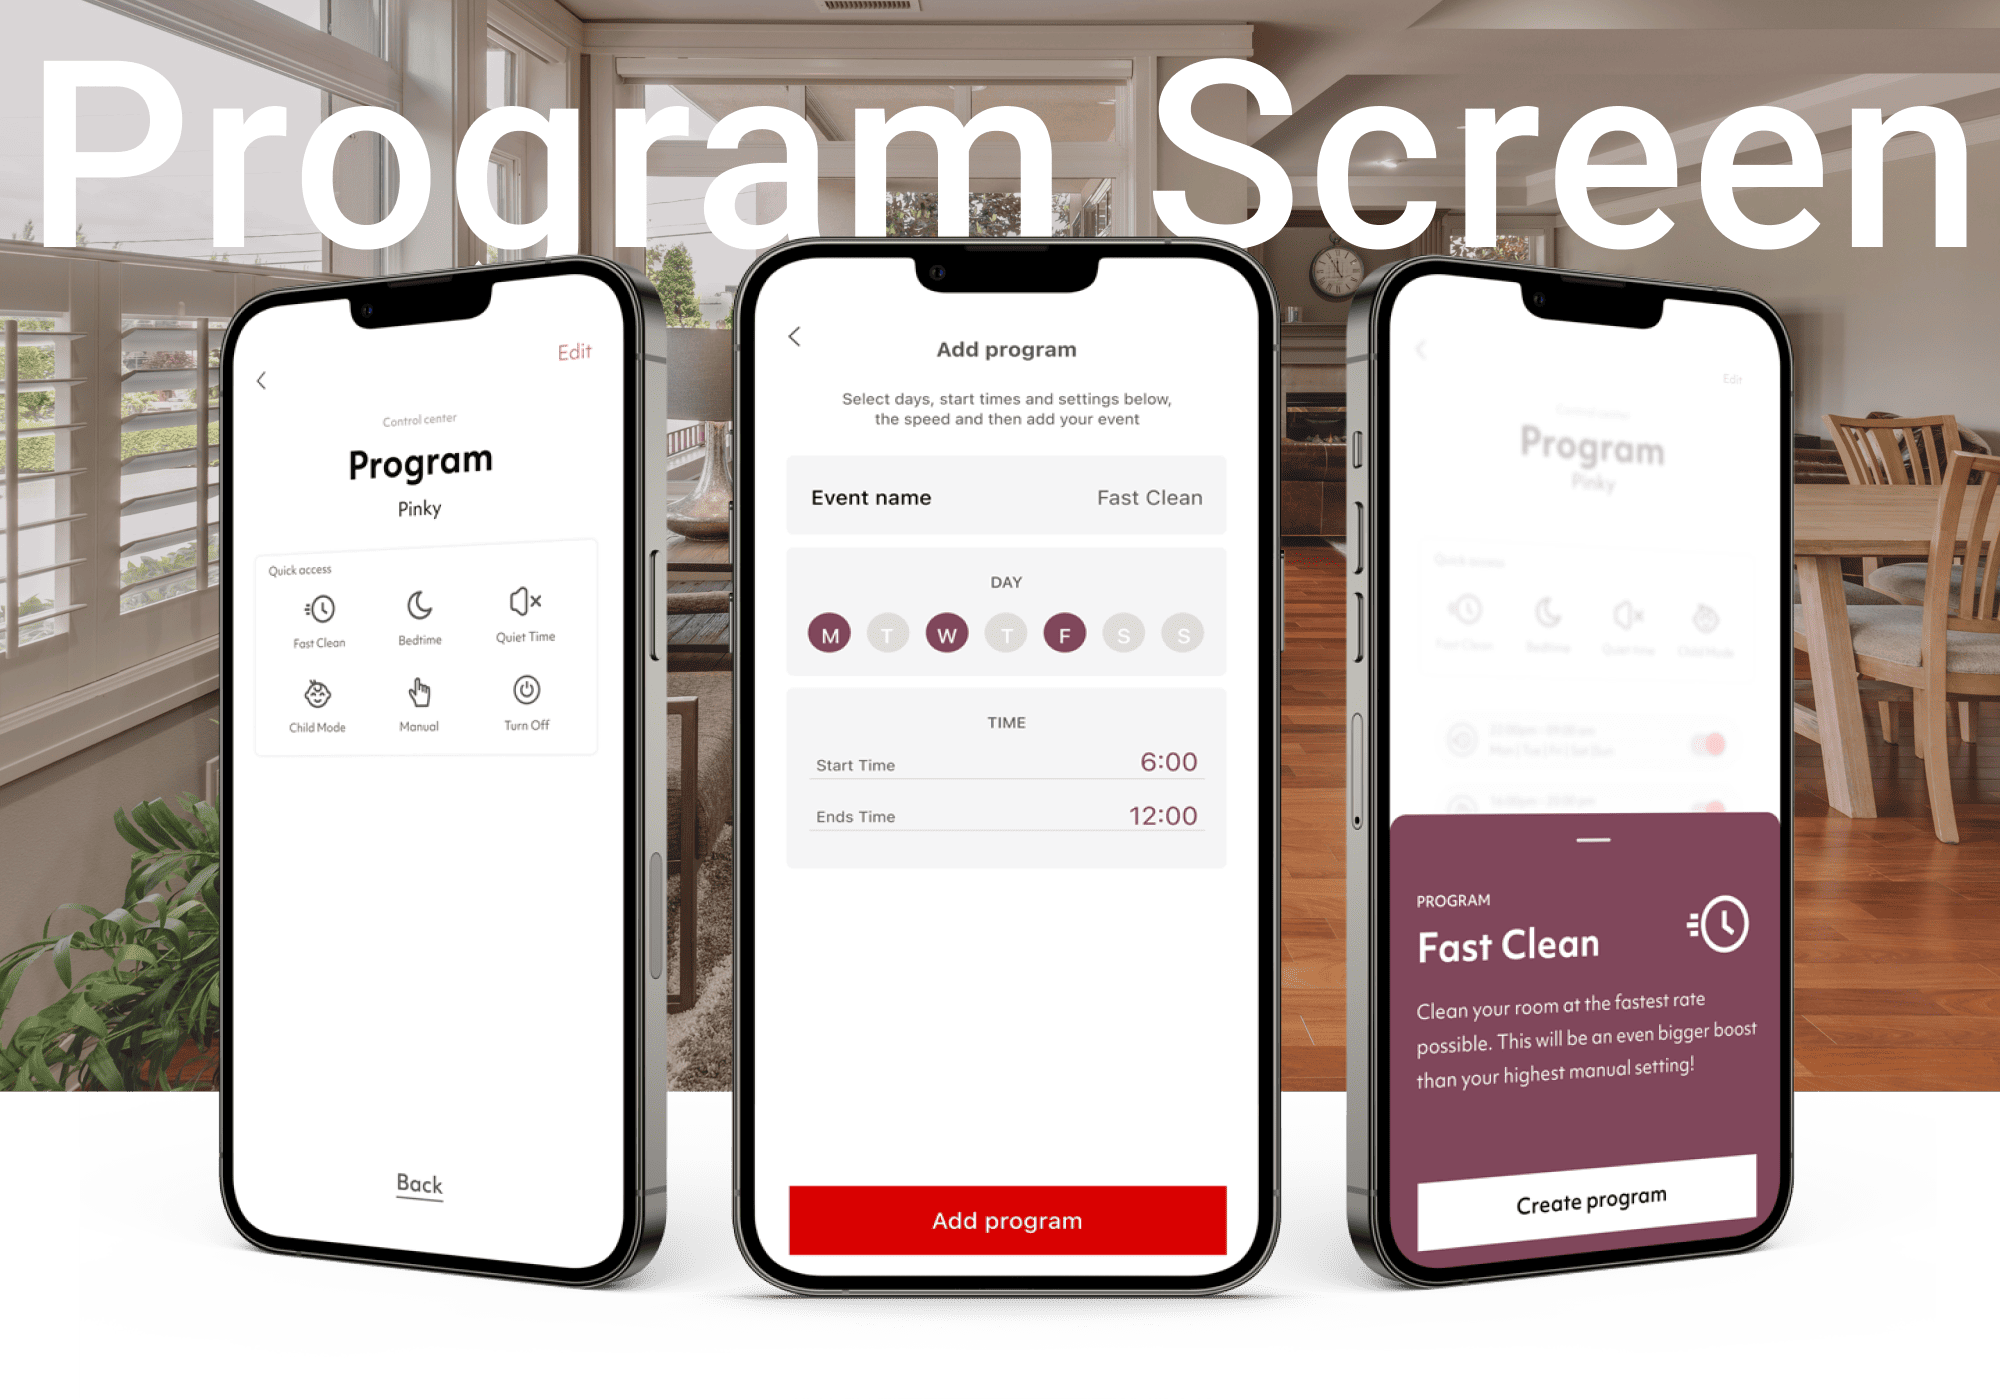
Living room with gray couch, a golden retriever lying on it, and an air purifier on the floor next to a smartphone showing the purifier setup app.Smartphone displaying an app with a map and air quality devices named Pinky, Grey, and Big Boy next to a laptop keyboard.Smartphone showing indoor and outdoor air quality analytics with graphs and good air quality indicators.Three smartphones displaying a program scheduling app interface for a cleaning device, showing program options, day selection, time settings, and a 'Fast Clean' program description.